New Realities Impact Our Ability to Forecast Natural Gas Markets. 

Part II: Historical Analysis of Cold Snaps.

If history teaches us anything - find the right data!

Analysis of cold snaps requires more than the typical fundamentals data.​​​​​​​

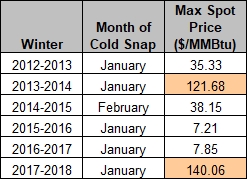
In Part I, we looked at some data from the most recent 2018 cold snap in the North American East to find out that during the event, the natural gas production glitches were  major contributors to the supply shortage. On some hubs, prices jumped above $100/MMBtu.


In our quest for an explanation of the natural gas industry failure to properly respond to the cold snap and possibly develop forecasts assisting in dealing with and preventing such expensive outcomes, we decided to examine how unique the situation in winter 2018 was. So, we looked at the historical data in New York between winters 2013 and 2018.


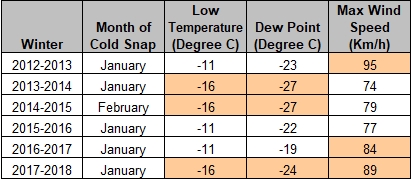
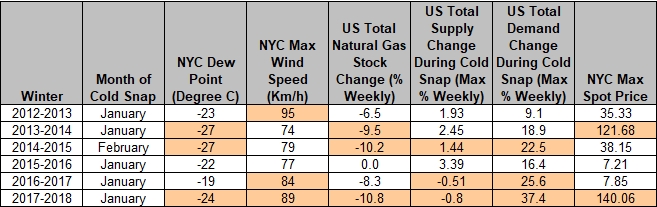
The first question we needed an answer for was whether inconsistent temperature patterns could be responsible for the recurring winter dramas. The short answer was “Not really”. Winter storms are consistent and can be predicted easily. Every winter, between years 2013 and 2018, New York experienced cold snaps with temperature declining to -11C… -16C (-27C with Dew Point) and wind strengthening into the 90s km/h, as shown in Figure 1: Temperature and Wind Speed in New York During Cold Snaps. Winters of 2014, 2015 and 2018 were the coldest on the record with the strongest winds blowing in 2013, 2017 and 2018.


Figure 1: Temperature and Wind Speed in New York During Cold Snaps (Source: AccuWeather)


Now, let’s check whether the sequence of natural gas market data developments in winter 2018 cold snap, as described in Part I, followed the same pattern during other winter cold snaps. Each winter between 2013-2018, during severe cold, the natural gas stocks fell consistently by around 10% on average on weekly basis, as shown in Figure 2: Natural Gas Stocks % Change during Cold Snaps (Source: EIA), with the biggest drops in 2014, 2015, and 2018 (highlighted). ​​​​​​​​​​​​

 Figure 2: Natural Gas Stocks % Change during Cold Snaps (Source: EIA)


After digging deeper into the supply-demand balance, we observed some discrepancies emerging. Data in Figure 3: US Supply and Demand % Change During Cold Snaps demonstrates that supplies dropped in 2015, 2017 and 2018 along with the biggest demand increases during the same time spans. Meanwhile, these disbalances occurred during the periods, which were not all the coldest ones.

Figure 3: US Supply and Demand % Change during Cold Snaps (Source: EIA)


It is expected that the temperature drops pushing demand up and accompanied by insufficient supply leads to price spikes. Meanwhile, the history showed us that the market response was not consistent. Only storms of January 2014 and January 2018 sent prices above $100, as shown in Figure 4: Spot Price Spikes in New York During the Month of Cold Snaps. ​​​​

​​​​​​​​​​​​

Figure 4: Spot Price Spikes in New York during the Month of Cold Snaps (Sources: EIA, NGI)


For an easy comparison, we combined all data in Table in Figure 5: Combined Data for the Cold Snaps. Only in year 2018, all fundamental data was aligned with the logical expectations for the drastic price jump to $140/MMBtu: high winds, freezing cold, declining supply and a giant jump in demand.  In 2014, the second highest price increase, the difference between supply drop and demand increase was not as significant as in 2018. At the same time, fundamental conditions in 2015, very similar to those in 2018, resulted in a price hike to $38/MMBtu, equal only to a third of the 2018 value. Low temperature and even stronger winds in 2013 and 2017 did not lead to extreme prices.

​​Figure 5: Combined Data for the Cold Snaps of Winters 2013- 2018


Consistently, every winter, the industry remains not so well prepared for the winter freeze and strong winds. At the same time, combined with extremely cold weather, rising demand and supply failures do not necessarily lead to exploding prices. In the end, analysis tells us that when taken in isolation, extreme temperatures, even in combination with strong winds, are not the only precursors of events categorized as “critical” by the industry.


To get a better understanding of what can drive such divergence, we decided to continue our analysis by looking into components of the natural gas pricing. One way to do it is by examining the drivers of the price projections. This analysis can also help to identify whether there is something risk management can do to be better prepared for mitigation of such events. In Part III, we will review the natural gas pricing trends and price drivers; we will also try to identify the baseline for a better fitting forecasting methodology.