New Realities Impact Our Ability to Forecast Natural Gas Markets.
Part I: Fundamentals During the Winter 2018 Cold Snap.
New Realities Impact Our Ability to Forecast Natural Gas Markets.
Part I: Fundamentals During the Winter 2018 Cold Snap.
Natural Gas Projections I / Natural Gas Projections II / Natural Gas Projections III
Diving deep into the freeze of winter 2018.
Review of the fundamentals' behavior during the cold snap.
In December 2017 - January 2018, the industry faced a shock on the wave of icy weather, which swept over the Eastern part of the United States. Some devastating events accompanied it.
Those are the highlights from the news reports on the January 2018 cold. So, we decided to look at what happened in the natural gas sector on the background of those events to establish whether there was any unusual market behavior that could lead to all those severe bearings. Our focus remained on the basics, supply and demand data.
The storm came down with snow, freezing rain and strong winds of a record-shattering cold snap. In New York, temperature dropped to -16C with -24C in dew point demonstrating strong deviations from the average and winds reaching almost 90 km/h, as shown in Figure 1: Weather in New York During the 2018 Cold Snap (Sources: AccuWeather, EIA).
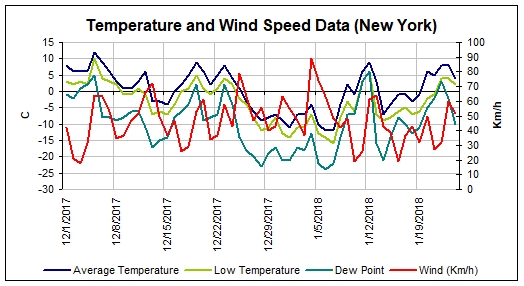
Figure 1: Weather in New York During the 2018 Cold Snap (Sources: AccuWeather, EIA)
The first reaction, no doubt, comes from the direct natural gas consumers who use this fuel for heating. In the last days of December, residential customers increased their natural gas burning rate by about 50%; this consumption rate sustained on that level up into the middle of January 2018, as shown in Figure 2: US Natural Gas Consumption (Source: EIA). Industrial customers increased their consumption rate by about 20%.
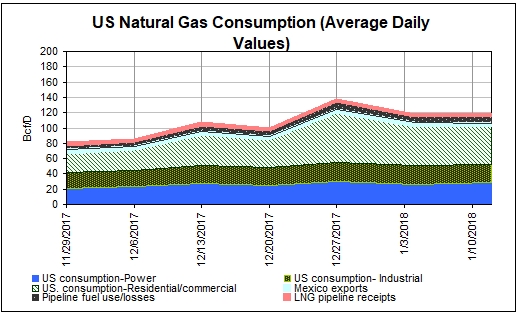
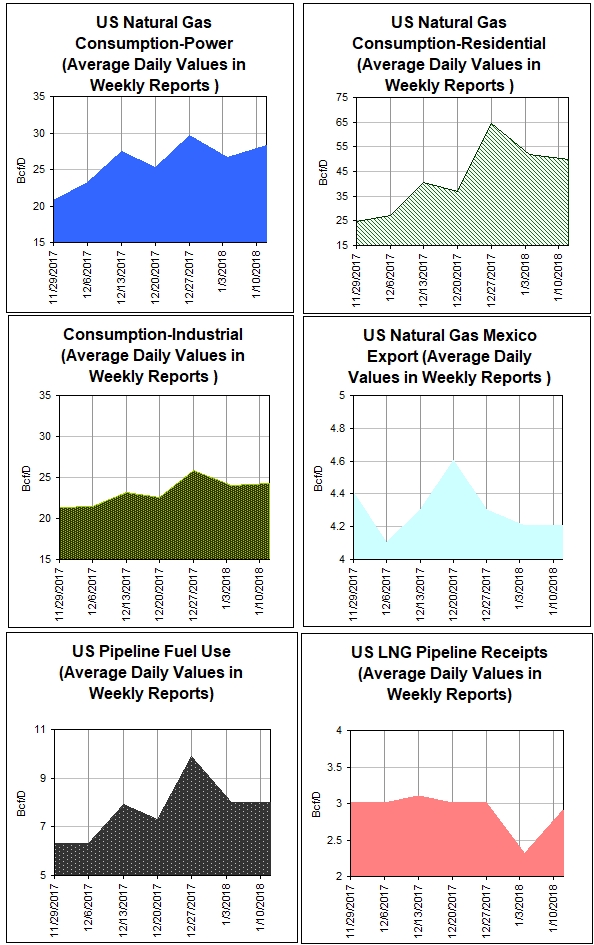
Figure 2: US Natural Gas Consumption (Source: EIA)
What about those who use electric heating? New gas-fired power plants have been built in North America in recent years to burn cheap natural gas and also provide an auxiliary support for the growing renewable generation, as shown in Figure 3: Electricity Generation by Energy Source (Source: EIA). Natural gas-fired power plants also usually run during peak demand, so it was likely them who took on the hit from the consumers using more electrical heating. This led to an increase of natural gas demand by power generators by about 30%, as shown in Figure 2: US Natural Gas Consumption (Source: EIA).
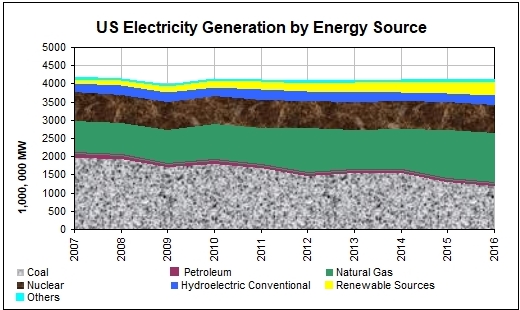
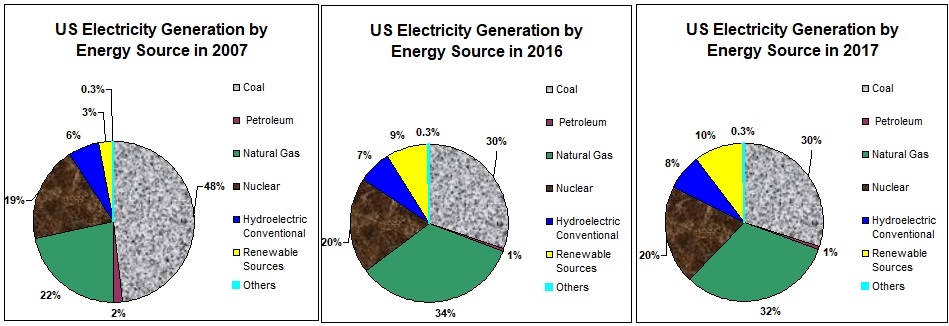
Figure 3: Electricity Generation by Energy Source (Source: EIA)
Increasing demand during adverse weather conditions is an expected outcome. Then we looked at the supply side.
... and the Eastern region was better prepared for the cold snap that the rest of the country. As shown in Figure 4: Natural Gas Stocks, prior to and during the cold snap, the total US stocks remained below the levels of the previous year and the 5-year average. However, the Eastern region stocks were replenished right before the winter bite to the levels exceeding those a year ago and a 5-year average. Presumably, it was expected that the industry was prepared for any weather adversity.
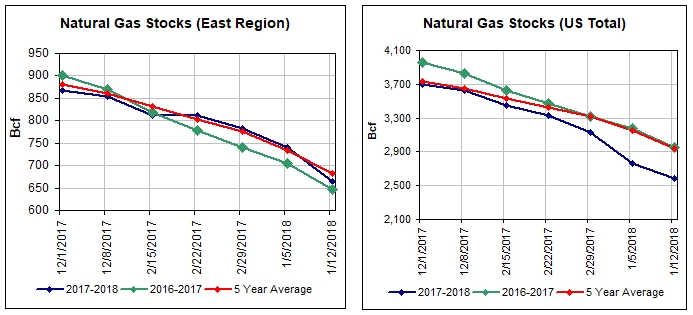
Figure 4: Natural Gas Stocks (Source: EIA)
Meanwhile, something happened on the real-time supply side.
This is not something one would want to see at the times of freezing cold, but the natural gas production started receding during that period. Total for US, the natural gas supply dropped by 2% on weekly basis, as shown in Figure 5: US Natural Gas Supply (Source: EIA). The major losses came from the production fields slightly counterbalanced by imports and LNG deliveries.
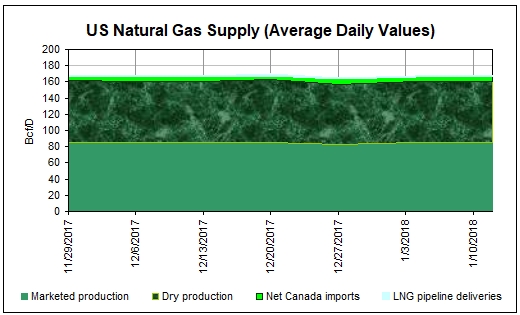
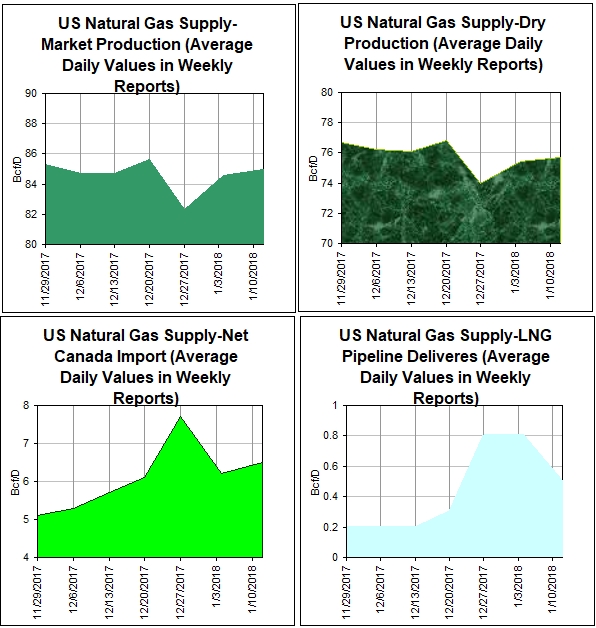
Figure 5: US Natural Gas Supply (Source: EIA)
During this period, the natural gas production output in the North Dakota’s Bakken was down more than 20%, Texas production declined by 20%, Oklahoma - by 22%, and Pennsylvania - by 5% in comparison with the previous month.
By most admissions, the main culprit of such reductions was the same freezing temperature, which caused the downstream infrastructure failure.
Natural gas exiting a well contains a varying amount of water in the vapour mix. Even though the gas is quite warm when withdrawn from the ground, this water can freeze when the outside temperatures get too cold. When it does, it blocks the flow channels forcing wells to shut-in.
What happened next was just a statement of obvious: supply and demand balance flew out of the window. During the event, supply decreased by 2% while demand increased by almost 40%.
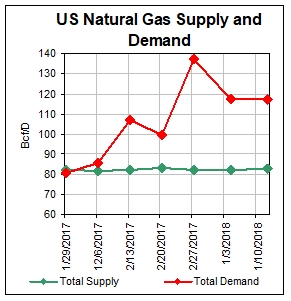
Figure 6: US Natural Gas Supply/Demand (Source: EIA)
With supply disruptions and steep consumption curves occurring simultaneously, natural gas prices were spiking simultaneously on several North American natural gas trading hubs. In Eastern US, natural gas price exploded, making it the priciest gas market in the world at the time. Prices settled at
about $140/MMBtu in New York and Chicago. Boston consumers couldn’t get natural gas at any price!
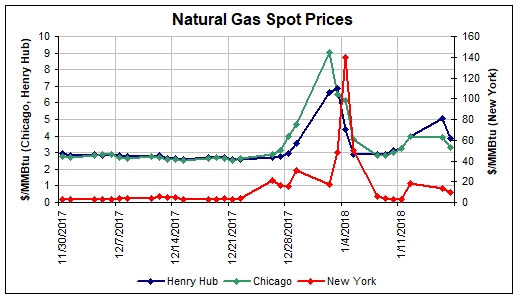
Figure 7: Natural Gas Spot Prices (Sources: EIA, NGI)
Different locations had slightly different reasons for such outcomes. While the New England situation could be partially explained by pipeline constraints, other places experienced a large supply/demand imbalance that got aggravated by dropping production.
Power utilities dealing with the natural gas shortage, had to switch to the diesel and gasoline-fired power production, which climbed above five-year seasonal highs. New England was relying on fuel oil for a remarkable 33% of its power supply. Those were not the only losses: utilities which were forced to run oil-fired generators and increased coal plant production, also lost their renewable certificates opportunities. The situation was moving from bad to worse with leaving no winners on the field.
There are two major layers to the conundrum: physical (infrastructure) and financial (market prices). Failing infrastructure created impediments to the supply deliveries thus distorting the supply – demand balance and contributing immensely to the price spikes.
Question: Why does the industry choose to accept the status quo and avoid investing in the existing infrastructure, which is apparently not built to withstand severe weather?
Our humble guess: It is likely because the economic analysis shows that the cost of managing damages from these critical events is lower than upgrading/rebuilding the infrastructure.
In the aftermath of such an expensive event, we decided to look further into the matter. In Part II, we review data from the previous years' weather events in order to establish whether the historic patterns exist with supply and demand behaving in the similar manner during cold snaps.
Contact us at info@ovgconsulting.com